
Sustainable Urban Reforms for Better Tomorrow

Dear Readers,
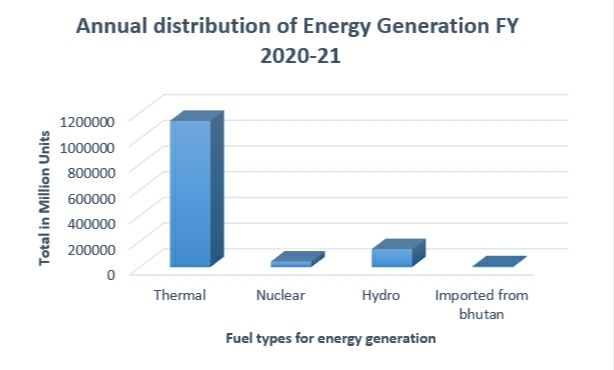
Electricity, today, is essential and integral to human life. Most of our most cherished conveniences as well as the infrastructure powering our cities and allowing us access to basic amenities are powered through electricity. India is also a developing nation and as such the country is poised to invest heavily into growth across all sectors of the economy to be able to provide a better standard of living to its vast population. To cope with this demand, India’s total power generation in Dec 2020 stood at 103.66 billion units across all sources like thermal, nuclear, solar, wind, etc. However, 75% of this is still produced through thermal power plants mostly running on coal.
Expansion for any sector also necessitates a substantial growth in the corresponding building infrastructure, especially in urban areas. The most recent reports state that buildings currently consume as much as 33% of electricity in India. In 2030, the Government of India expects to add 1 billion square meters of commercial space. Therefore, electrical energy demand is expected to grow at a Compound Annual Growth Rate (CAGR) of 11% (2020-2030) from 414 TWh to 1,180 TWh by 2030. (MoP, 2017) When comparing that with India's current fossil fuel heavy generation, India consumes 372 TWh of electricity per year - 24.4% for residential use, 9.4% for commercial use, and 67.6% for other uses (industry, agriculture, etc). (CEA)
The building sector in India is at a key flex point today. What we build today, will serve as the foundation for the next 50 years and will lead to job generations by the next decade. Therefore, attention to the building sector and its energy efficiency should be our prime focus. Energy-saving potential through ECBC is projected to be 90 TWh / year in new buildings & 9 TWh / year in old buildings. (BEE, 2020) Split incentive exists in the building sector for energy efficiency; thus, the lowest initial cost is often the determining factor for the sector. Here we cannot afford a ‘penny wise pound foolish’ policy if we want our sustainable urban policy to succeed. The absence of a unified industry voice to prioritise sustainability and safety in buildings is another area we must keep in mind.
An interesting approach to approaching sustainability could be through looking towards our ancient village settlements (like Jaisalmer), which have been proven to be more resilient and a good model for architecture optimised for local conditions & resources. However, these kinds of approaches may not be practical or implementable in all cases, especially in an urban setup. Many of our cities grew organically as economic activities increased, and population inflow took place. Yesterday's peri-urban areas overnight became core areas of the expanded city. City & building planning typically always play a catch-up game in such situations and is not able to tackle the resulting challenges and stresses proactively.
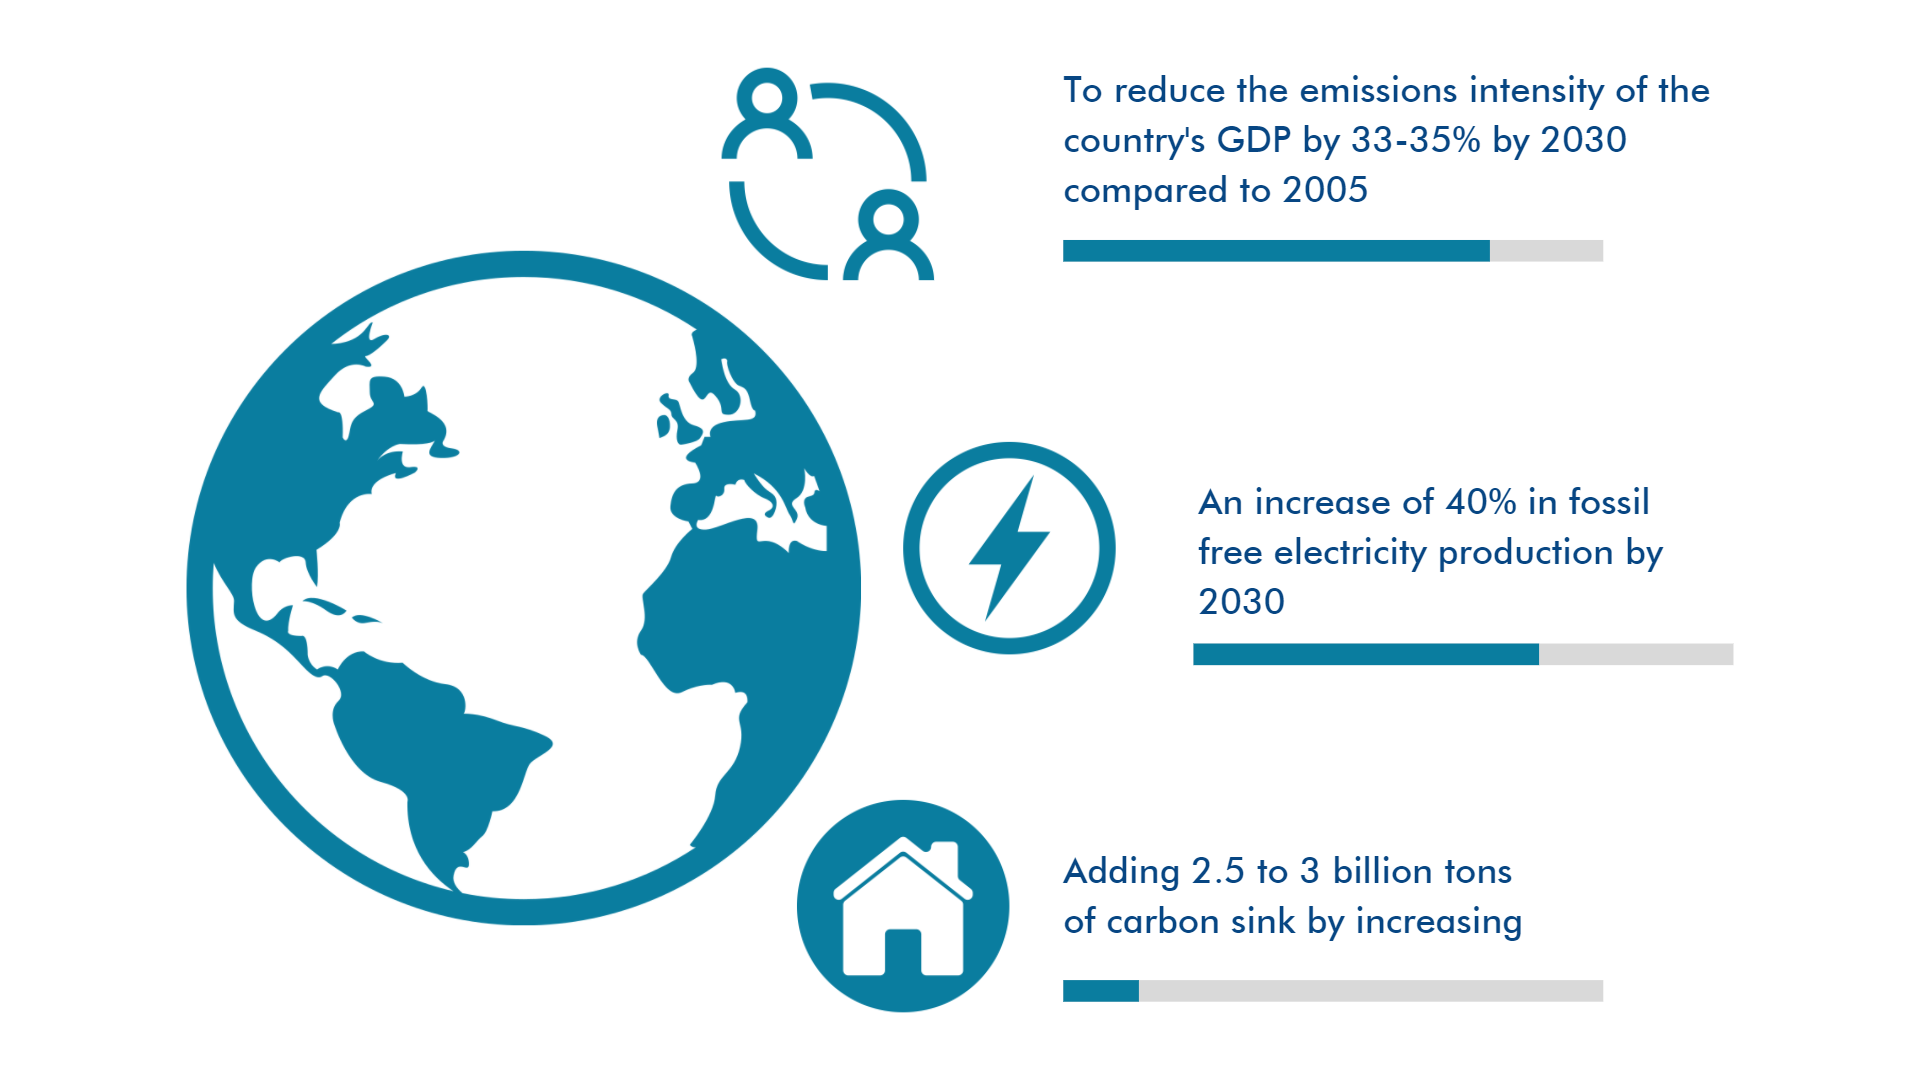
The world forum commitments as per the ‘Carbon Neutral by 2070’ objective, require both regular citizens, as well as the industry and the policy-making bodies to actively engage in a collaborative and impactful manner. The community has to be at the core of all policy decisions if we want to leave a better place for our future generations. Transparency in our policies and reform processes would surely provide much-needed accountability in our initiatives.
In this newsletter, a few areas and developments around policy and reform for sustainable urban India of the last decade are brought to your attention. We would welcome all suggestions and thoughts in response to the same. Stay safe and healthy.
(Guest Editor)

Introduction
India, the most populous country in South Asia, has experienced an unprecedented increase in the urban population more than 14 times between 1901 and 2011. (Nandy) As per the Census of 2011, 377 million people were living in urban areas then. At present the number has increased to 481 million which is about 34.93% of the total population of India and an expected growth rate of 814 million by 2050 would outpace the last four decades. (TERI, 2021)
With the increase in the population, the city-centered economy makes up 80% of the global economy, they are also responsible for rapid degradation, resource consumption, and contribution to more than 70% of CO2 emissions. As the necessity of time, it is essential to develop policies and schemes that promote sustainable growth within cities in a way that is well-crafted.
Hence, this newsletter will attempt to shed some light on the present challenges in the urban area, as well as how various emerging innovations and developments can help mitigate these challenges.
Challenges: Current Urban Policies in India
In corners of the world, the inefficiencies of service utilities still persist. The census of 2021 is still underway due to the ongoing pandemic, but the status of development can be still assessed by the Joint Monitoring Programme (JMP), an initiative taken by the World Health Organisation (WHO) and United Nations Children's Fund (UNICEF) to assess the progress made in drinking water, sanitation, and basic hygiene services globally. The missions and schemes announced earlier by the Government of India are meant to improve urban services through increased transparency and accountability. The Energy Conservation (EC) Act, 2001 is entangled with directives on standards and labels.
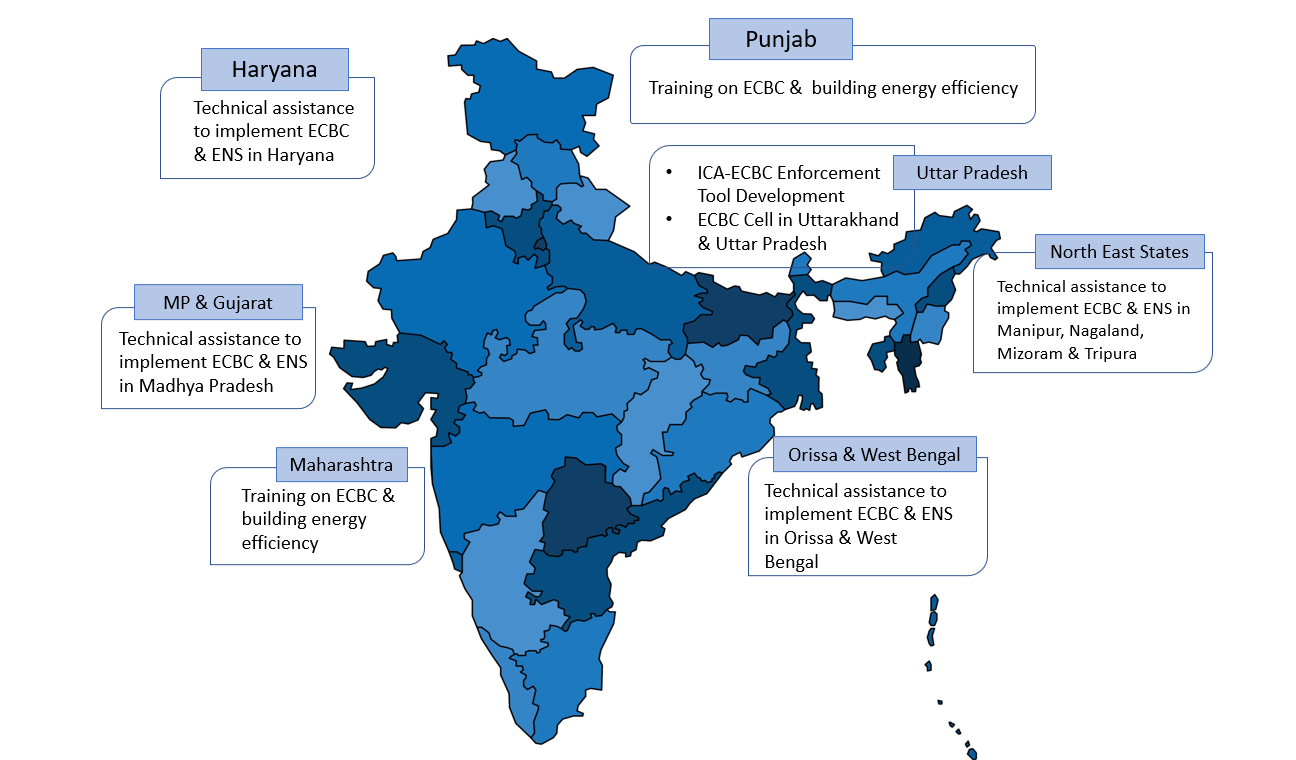
This helps in the selection of equipment and minimum setbacks for buildings to achieve green certifications. Despite the launch of the ECBC in 2007, its adoption in the states and its subsequent enforcement through the municipal structure has been slow and exhausting. (ECBC, 2019) As a result, GIZ along with the Bureau of Energy Efficiency (BEE) proposed the establishment of Eco Niwas Samhita cells for effective implementation of residential building energy efficiency policies, IGEN-EERB, where GreenTree Global facilitated this effort by mandating the ECBC codes in various states, as illustrated in the image below.
Further, Credit Rating Information Services of India Limited (CRISIL) reveals National Determined Contributions (NDC's) own goal of 175 GW by 2022 would require investors to contribute an additional 330 billion dollars. A reflection of this gap in funding is reflected in our study which illustrates financial contributions made by many donor agencies to the reduction in the percentage share of funding from 85% in 2016 to 65% in 2021. (Global, 2021)
As per the study conducted by GreenTree Global for International Donor Mapping. The 2011-2021 census will see a significant increase in greenfield developments due to the expansion of suburbs. A development of this nature would demand a significant amount of support from rural areas to increase economic interdependence.
Green building market in India
A simple way to assess the nation's growth depends on the percentage of green buildings projected for various functions. The home-grown green certification system for green buildings under the aegis of the Confederation of Indian Industry (CII) has been recognised by some state and central agencies, providing incentives for building types to add green building certification to their projects.
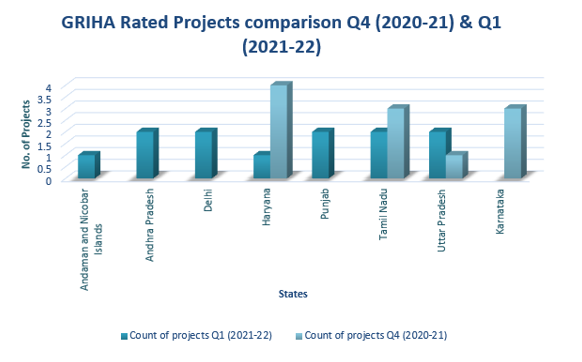
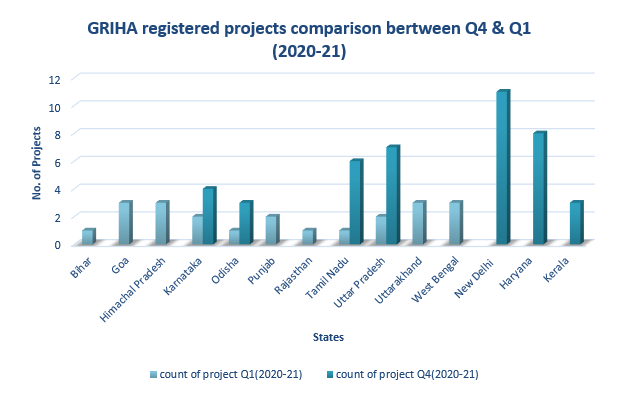
Similar to the previous Greenletter for Q4 (2020-2021), Maharashtra shows outstanding participation in Q1 (2021-2022) under GRIHA (15), LEED (13), and IGBC (14) rating systems. This is followed by the increase in Floor Space Index (FSI) and a further increase by 3-7% for green buildings. On the other hand, due to the ongoing pandemic, participation of Delhi and Haryana in new green rating projects has decreased tremendously in the first quarter (2021-2022), but Punjab and Tamil Nadu have been able to climb up the rankings in Q1 (2021-22) as compared to the previous quarters.
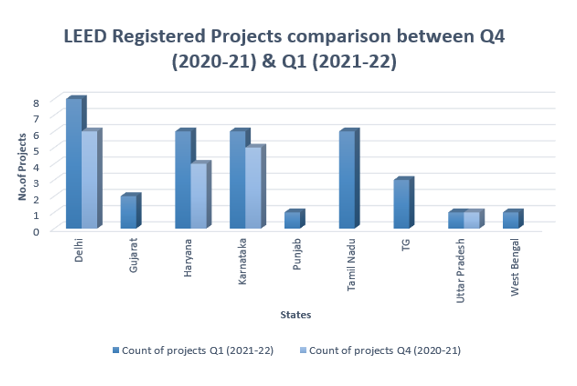
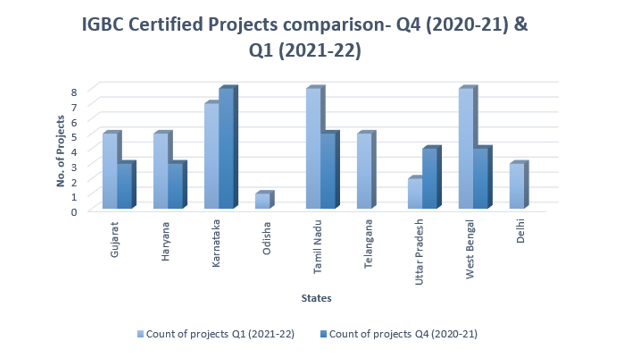
Please note that of all the rating systems shown above, Maharashtra has the highest number of green projects, however, to evaluate the impact of other cities, we have removed Maharashtra from the graphical representation.
The State of Tamil Nadu
The Smart City Mission (SCM), launched in 2015 under the Ministry of Housing and Urban Affairs (MoHUA), analyses the 100 selected cities to determine their ability to move from one level to the next in development, guided by principles of making the most of limited resources.
It is envisioned that the winning Smart City Mission will serve as a model city for other cities around the country, catalyzing their creation. So far as per the Fourth round of Winning cities, Erode (Tamil Nadu) has come up in the front line to get financed for “Smart“ roads, cycle tracks, walking paths, smart classrooms, rejuvenation of water bodies, skill development centers, up-gradation of health facilities and integrated command control centers. (groups, 2018).
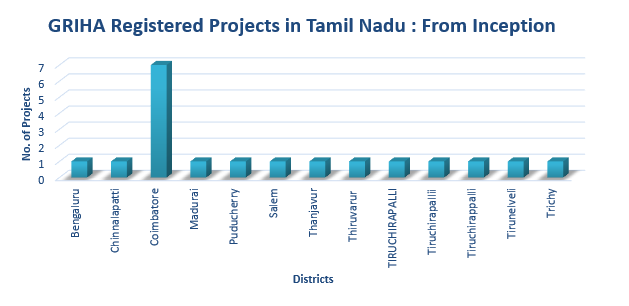
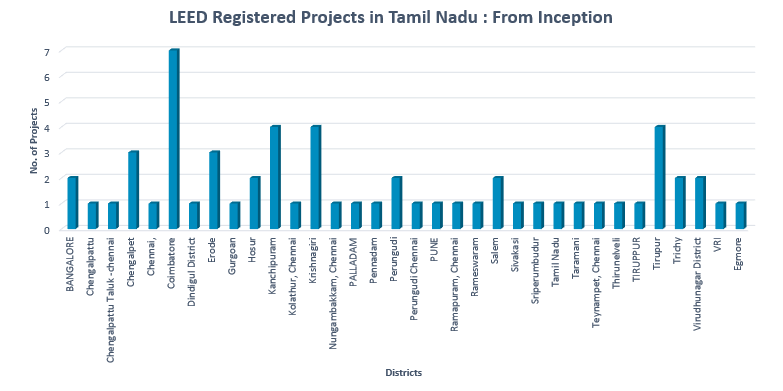
Based upon the data provided by LEED, IGBC, and GRIHA, we present a graphic depiction of the green-rated buildings within the state.
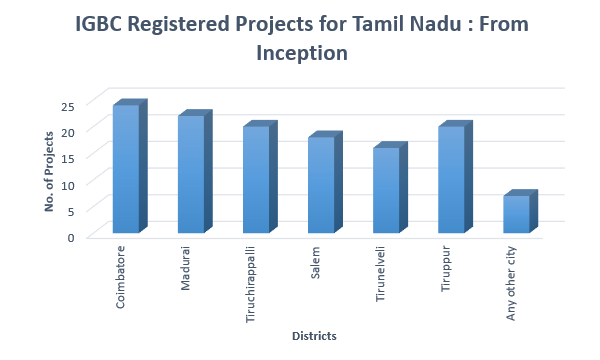
Please note that of all the rating systems shown above, Chennai has the highest number of green projects, however, to evaluate the impact of other cities, we have removed Chennai from the graphical representation.
As indicated by the data received, Chennai, the capital city of Tamil Nadu, has the most projects in all three rating systems, LEED (192), GRIHA (31), and IGBC (382). Before concluding the data, two factors need to be considered in this segment. First, the degree of development over the service facilities can be easily observed in Erode in comparison to Chennai due to its clutter-free zones. Second, if you consider the population density per area, Erode has a lower density of dwelling units, reflecting a substantial number of green buildings to impact the available data. This is by the decision of Erode municipalities, who prefers to develop urban infrastructure to diversify and boost economic activity in the area, before increasing the number of green buildings.
Integrated Urban and Electrical Reforms
In line with "A roadmap for the global energy sector," published by the IEA, about three-quarters of greenhouse gas emissions come from the energy sector. GreenTree Global's study on the integration of urban and electrical infrastructure reveals the heterogeneous and complex nature of city growth leading to three categories of gaps: Tangible Gaps, Administration Gaps, and Policy and Advocacy Gaps. These gaps, as if one observes, showcase the following major challenges -
· The quantifiable parameters define the overuse of services without backups and the neglect of the proper inspection of existing infrastructure conditions by the growing demand.
· The administration gap states the lack of inter-departmental coordination between various agencies, especially at the planning stage leading to insufficient transparency and unplanned fragmentation of urban utilities.
· Policy measures are taken by the state and central governments always show a gap in their implementation. Such gaps occur as a result of miscommunication and the absence of key stakeholders of service utilities during the planning process.
To subsidies these barriers, we need to initiate the intervention of new technologies such as new transformer distributions, demolishing older infrastructures, and up-gradation of monitoring and evaluation of the master plans every five years to target the enhanced efficiency of the service utilities.
At present, a robust initiative would include the integration of IoT and new technologies to improve reliability, asset utilization, efficiency, and integration of renewable energy into the grid to improve grid management. Therefore government launched the Integrated Power Development Scheme (IPDS) in 2014 to track and monitor the flow of electricity in various circles of cities and enhance the transmission and distribution network efficiency throughout India. As per the capita consumption for FYI 2020-21 indicated in the graph below, shows that each person consumes 1208 kWh. Multiplying this figure by the population of India for 2020-2021 (1.4 billion) indicates that 21% of the population has no access to electricity or insufficient supply.
Integrated City Level Green Movements
We all know IGBC as the country's premier body for green building certification. As of 15 February 2022, 7,273 projects, equivalent to 8.07 billion sq. ft, have adopted various IGBC Green, Net-Zero, and Healthy Building Ratings.
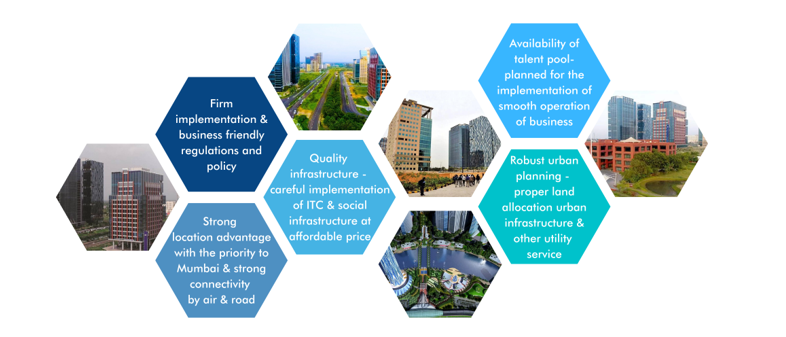
Gujarat International Finance Tec-City, a GIFT city, in short, has won the prestigious Platinum rating under the IGBC Green Cities. This city is a Gujarat government initiative, designed to become a global financial service hub attracting major MNCs. Hence a chance to boost the economic activities across the state of Gujarat. The project which was implemented through a Public-Private Partnership (PPP) format, focuses 6-8% share of the business in the city through the following34567890 strengths –
Another great way to analyze a city's growth is to use monitoring systems. In Gift City, an incubated ICT system lets them analyze their growth. Therefore, the TRACE tool, developed in the year 2008 by Energy Sectoral Management Assistance Program (ESMAP) provides municipalities, with a quick and easy way to monitor the energy usage in a city and identify cost-effective measures to improve it. Its limitation accounts for the finite number of cities for analysis, hence ignoring the diverse climatic conditions of India, which does not make it the best technology to comprehend the cause of energy efficiency problems in the cities. Meanwhile, it is inevitable to understand the transitioning level of cities, without a baseline aligned with the national and interlinked social-economic infrastructure attributes. Hence, innovative tools such as India Energy Dashboards (IED), Building Energy Efficiency Program (BEEP) Dashboard, and the National Ujala Dashboard, have been developed to raise awareness and encourage energy-efficient devices for various building typologies in the nation.
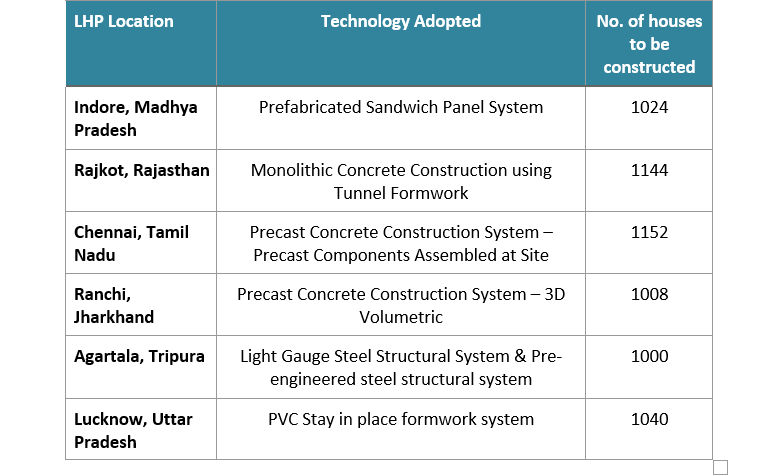
Lighthouse project (LHP) technologies (emerging innovations & technologies)
Due to the diverse nature of Indian climates, it is essential to design houses with materials attuned to the environment of developing areas to achieve maximum thermal comfort. (ECBC) to encourage large-scale participation of people to create technical awareness for on-site learning, the government took the initiative under the Pradhan Mantri Awas Yojana to surface Light House Projects (LHPs) that work in tandem with the environment.
Model housing projects with selected alternate technology suitable to the region's climate and hazard conditions have a 12-month deadline for governmental approvals and timely delivery. Also, being a LIVE lab to field applications, such as planning, design, production, construction, and testing, engineering institutions, professionals, and stakeholders would gain a better understanding of the market's future.
Although the actual status of the project is unknown, a theoretical mention of 43 lakhs of housing units has been completed. Considering the ongoing pandemic, it is reasonable to expect slow progress, however, as a result of the replication of these projects, a new set of guidelines will emerge, which will be more strategic and mindful of the adverse effects on the environment.
UK Pact: Supporting electrifying urban mobility in Kakinada
Andhra Pradesh's E-Mobility Policy 2018-2023 plays a crucial role in turning the state into a paradise for investors. The Kakinada Municipal Corporation (KMC) and the Kakinada Smart City Corporation Limited (KSCCL), in conjunction with Research Triangle Institute (RTI), GreenTree Global, India-Lead, and Urban Mass Transit Company (UMTC) is on the second stage of an effort to accelerate the use of electric vehicles in Kakinada district of Andhra Pradesh by –
- Fast-tracking uptake of electric vehicles for public transportation through schemes and policies
- Analyzing future mobility patterns and the issue of air quality,
- Development of sustainable business models and Green procurement strategies,
- Stakeholder consultations and capacity-building sessions.
Experts from World Resource Institute (WRI), Siemens, Volttec, Bounce Infinity, Charge Up, Convergence Energy Services (CES), Micro Grid Lab (MGL), Alliance for an Energy-Efficient Economy (AEEE), Off-Grid Consultant (OGC) have collaborated to discuss a wide range of topics regarding the advantage of electric vehicles in the capacity building programs as stated as below -
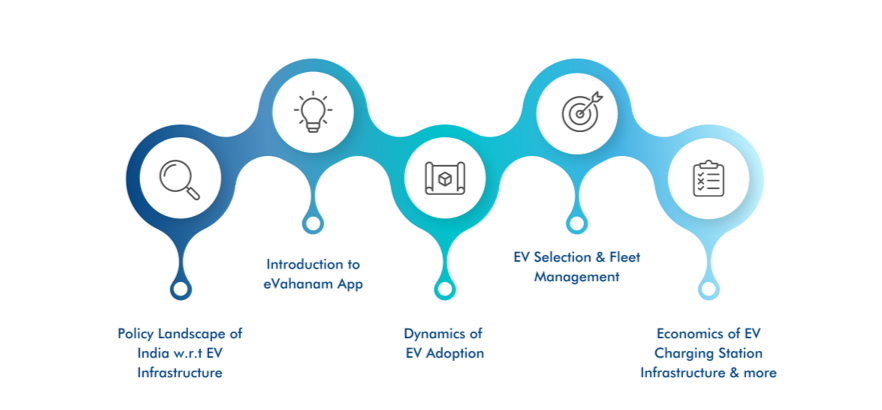
The eVahanam App, developed during the tenure of the program provides the latest news regarding developments in the field of e-mobility in India. The app features a list of e-mobility policies for each state in India as well as case studies and interviews with EV owners. This App can also be used for an instant overview of state incentives and guidelines for every state in the country.
Our long-term goal is to replicate the program's success in other willing cities. Please reach out to us at [email protected] for more information on how we might create a similar program in your city if the program interests you. Our preference would be for existing relationships with city authorities in your city to be leveraged to tap into the underlying potential of your city to further the program's objectives.
In-house Experts Comments
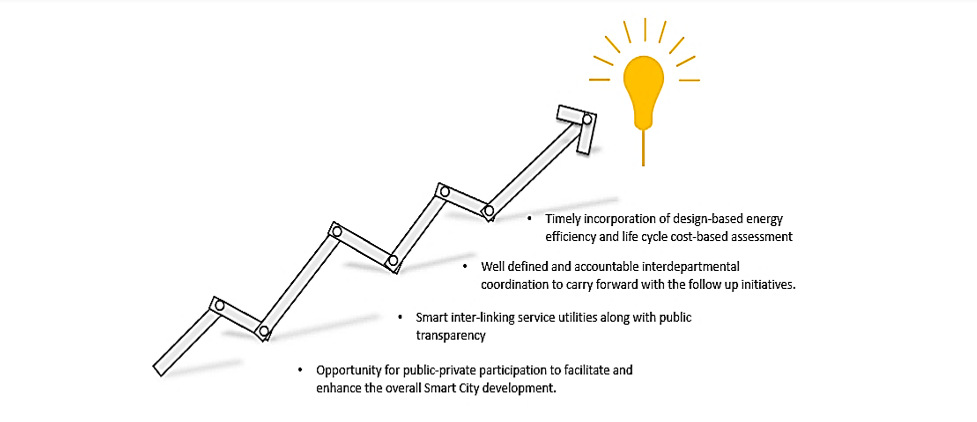
According to our team, the current integration of the urban and service infrastructures requires an improvement in terms of adopting various parameters at the consumer load end. If we consider the example of GIFT city, it can serve to encourage other cities to at least build infrastructures that are secure, clean, and transparent in their developments. To keep track of the city's changing needs, a new management team at the ULBs needed to be trained to keep track of the city's growing population. It may take such an intake in the form of guidelines and policies for the authorities to take matters seriously. Using this systematic approach can lead to further opportunities such as –
What’s next –
- Heatwaves impact in India
- Demand responsive Net Zero Buildings
- EV’s impact on Urban energy planning
- Updates on Green Building Market
What have you missed?
- Transforming the E-Mobility Urban Landscape in India
- Sustainable Cooling for Thermal Comfort
- Green Jobs: A Perspective from the Green Buildings Market
- Introducing First Green Building Newsletter of India
Note: The team has sourced data through various rating agencies and desk research. Collaboration with other rating agencies is in progress to make the information comprehensive. The team works tirelessly to put forth green building development news for our readers. Please give us due credit before re-creating our work. We would appreciate collaborations and joint efforts if floated our way. For any query, please contact: [email protected]
GreenLetter (GLMAY22) Team